Basic characterization of the mechanical behavior of organosandwich semi-finished products with ThermHex honeycomb cores and 2-ply cross-ply top layers consisting of UD-tape individual layers (PP-GF) was carried out by out-of-plane compression and shear tests as well as flexure tests with specimen pieces taken from flat sandwich panels. Here the specimens were statically loaded to failure with the help of a universal testing machine, and stiffness and failure loads determined.
Compression tests
The compression tests were carried out on specimens with a square cross-section in accordance with ASTM 365M. During the test, the load displacement curve of the test machine was recorded. In addition, the relative displacement of the two stiffly mounted compression dies and also the elongation of a side-gated lateral surface of the specimen were measured with the help of the gray-value correlation system ARAMIS.
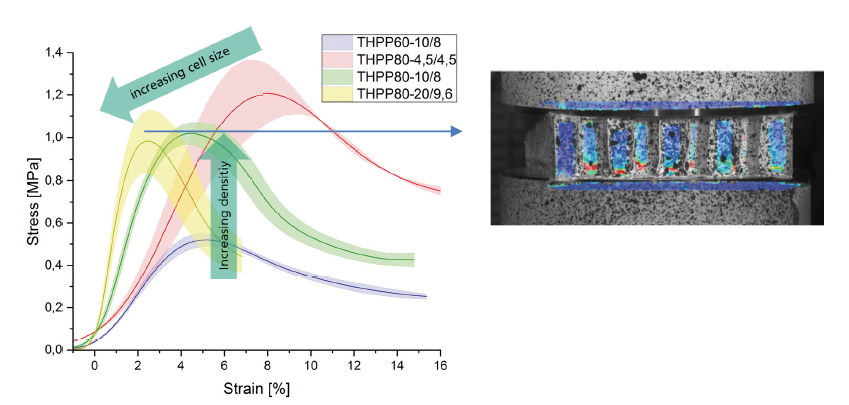
(left); strain localization (qualitative) upon reaching maximum stress
(THPP80-20/9.6) (right)
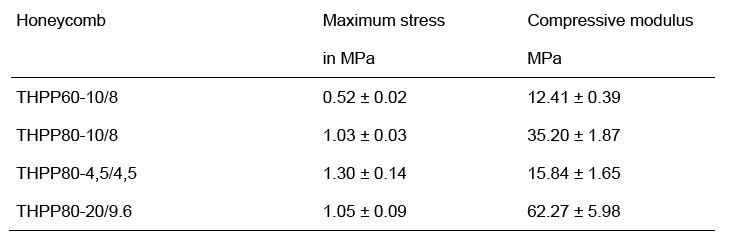
In tests carried out on honeycomb core materials of different densities (60 and 80 kg/m³) and also core height (4.5; 10; 20 mm) and cell size (4.5; 8; 9.6 mm), the following tendencies are observed in the compression properties measured; as the core density rises (respectively increasing cell wall thickness) the compressive modulus and compressive strength of the core increase. As core height and cell size increase, the compressive modulus increases while compressive strength falls.
Shear tests
The shear tests were carried out on the basis of ASTM C273M as a tensile plate shear test. Here the cuboid sandwich test pieces were bonded to two load introduction plates. Shearstress/shear-strain curves were calculated from the force signal of the testing machine and the optically measured relative displacement of the test piece. Specimens were tested in each case in the W and L directions of the honeycomb core.
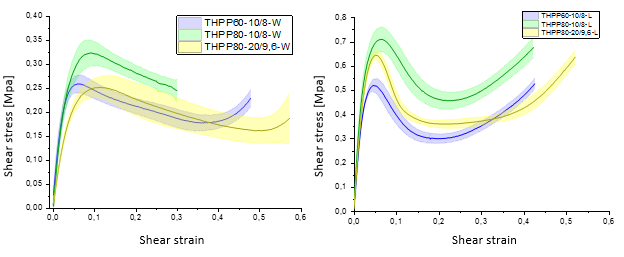
with shear in the W direction (left) and L direction (right)
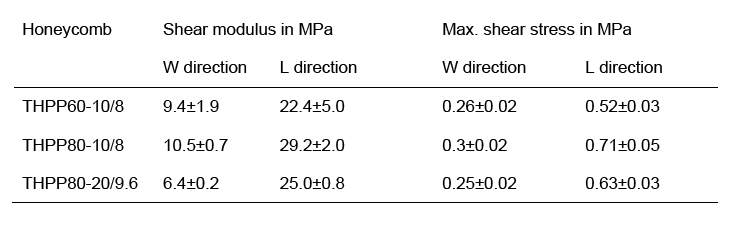
Fig. 2 shows the shear-stress/shear-strain curves measured. Depending on the test direction, significant differences in shear behavior can be seen. In the L direction, shear moduli up to three times higher occur. The first stress maximum in the L direction is about twice as high. In addition, influences of the honeycomb core density (here 60 and 80 kg/m³) as well as the core height and cell size can be seen. With an increase in the core density, an increase of the shear modulus and also the first stress maximum occur for both test directions and the same core height and cell size. Increasing both core height and cell size but keeping the same core density leads to a decrease in the shear modulus and stress maximum. This is especially evident when testing in the W direction and can be attributed to the deformation mechanisms involved and the special nature of the ThermHex honeycomb core with its partly unconnected cell walls in the W direction.
Flexure tests
The flexure tests on organosandwich test pieces were carried out on the basis of ASTM C393 as 3-point flexure tests. For this purpose, appropriate sandwich specimens were tested with different support distances (200, 300 and 400 mm). During the tests, the center deflection of the test piece was measured by means of an extensometer. In the tests with a short support distance, it was often possible to observe a shear failure of the core and, in the case of honeycomb cores of lower density (60 kg / m³) or greater core height and cell size, also local indentation of the core in the area of the upper support. In the case of larger span lengths, however, a failure of the upper, pressure-loaded top layer (top-layer wrinkling) was often observed.
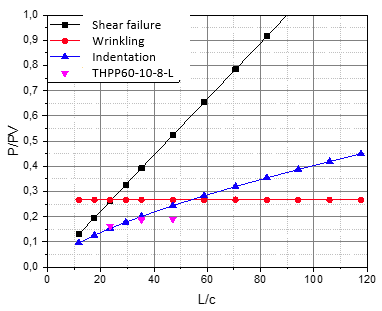
The flexural failure loads determined at different span lengths were plotted in a diagram as normalized failure loads against span length and sandwich height. These so-called failuremode maps [1][11] can provide information about which sandwich configuration (core density, core height, top layer material) should be selected for a particular application (span length) for a given load. Here, in addition to the measured values, additional graphs are prepared for the different types of sandwich failure (including local core indentation, top layer wrinkling, shear failure of the core) (see Fig. 12). In this way, the top layer and the core can be mutually adjusted as efficiently as possible. Ideally the honeycomb core should have mechanical properties high enough to allow the best possible exploitation of the mechanical strength of the top layer.